- In 2020, there were 5,058 hospices.
- Medicare hospice expenditures totaled $22.4 billion.
- In 2020, more than 1.7 million Medicare beneficiaries (including almost half of decedents) received hospice services.
- In 2020, the number of hospice providers increased by 4.5 percent, due to growth in the number of for-profit hospices, continuing a more than decade-long trend of substantial market entry by for-profit providers.
- Between 2019 and 2020, average lifetime length of stay among decedents grew from 92.5 days to 97.0 days, and the median length of stay was stable at 18 days.
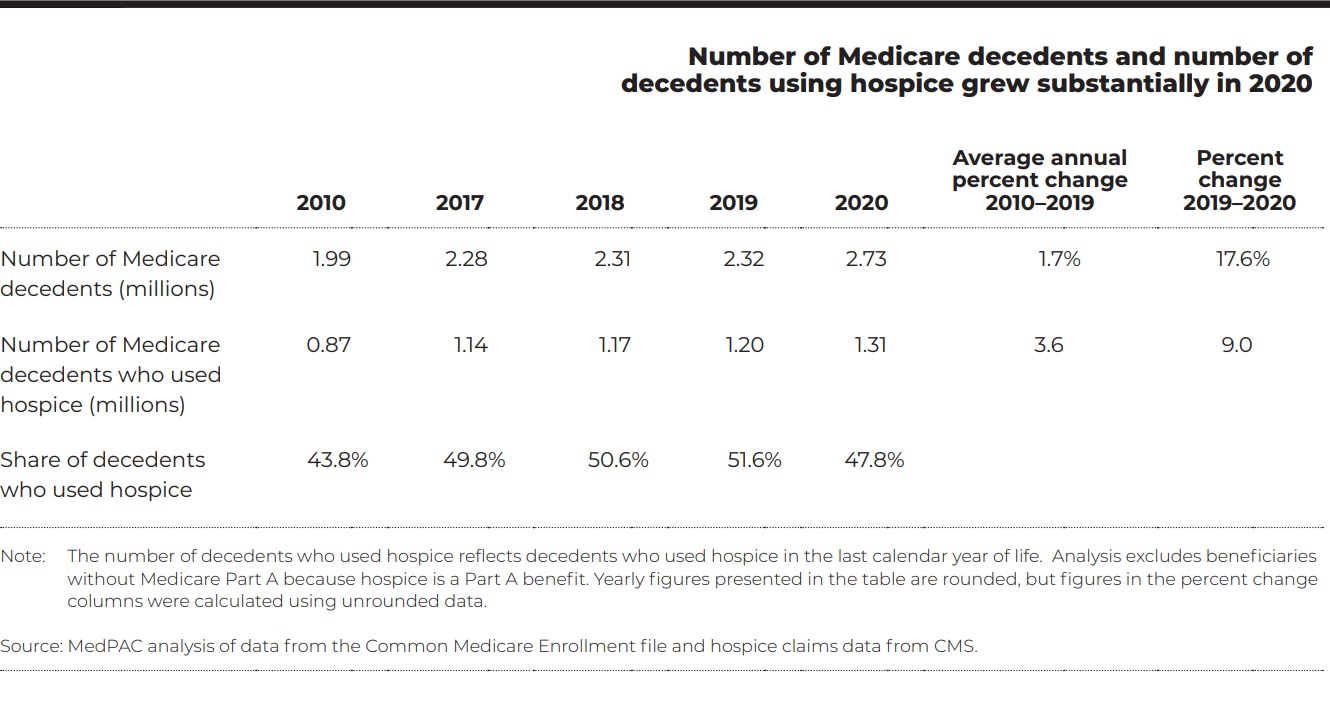
- Volume of services: In 2020, the number of beneficiaries using hospice services at the end of life continued to grow. However, the share of Medicare decedents using hospice declined between 2019 and 2020, from 51.6 percent to 47.8 percent, as deaths increased more rapidly than hospice enrollments.
Number of Medicare decedents and number of decedents using hospice grew substantially in 2020

- Cost growth: Between 2018 and 2020, hospice cost growth was generally modest. Average cost per day for routine home care, the level of care that accounts for more than 98 percent of hospice days, increased 0.5 percent between 2018 and 2019 and 1.2 percent between 2019 and 2020. In contrast, average cost per day for general inpatient care, inpatient respite care, and continuous home care, which are provided relatively infrequently, rose substantially in 2020.
- Aggregate Cap: The cap limits the total payments a hospice provider can receive in a year in aggregate. The aggregate cap functions as a mechanism that reduces payments to hospices with long stays and high margins. In 2019, about 19 percent of hospices exceeded the cap; their Medicare aggregate margin was about 22 percent before and 10 percent after application of the cap.

Other Articles You Might Enjoy
Improving Outcomes Between Home Care and Medicare Advantage Plans
Home care services have emerged as a critical strategy for improving health outcomes, reducing hospital readmissions, addressing both clinical and non-clinical needs, and improved patient satisfaction among Medicare Advantage beneficiaries.
Average 30-Day Readmission Rates by Medical Conditions
We provide critical readmission data about average readmission rates, condition-specific readmission rates, and hospitals with high and low readmission rates.
Hospital-at-Home Readmissions: Which Medical Conditions Created the Highest and Lowest Readmissions?
CMS’s report on the Acute Hospital Care at Home (AHCAH) initiative highlighted the highest and lowest readmission rates by medical conditions.


