Data for Conversations with Various Payer Sources to Align Your Organization’s Services to Reduce the Cost of Care and Readmissions
Payer and ACO conversations these days are focused on the cost of care. How is your organization presenting data to show your value in reducing the cost of care especially with the top highest five medical conditions? This becomes an important strategy in your conversations with Medicare Advantage Plans and ACOs.
It’s easy to identify the cost of care from your own data collection. In this article, we provide you with the top 5% of highest spenders and the most common conditions. Compare this information to your data collection to better understand the value you bring as a partner both to payers and ACOs that have responsibility for risk.
Highlights
- About three-quarters of aggregate expenses for persons in the top 5% of spenders were paid for by private insurance or Medicare.
- In 2018, the top 1% of persons ranked by their healthcare expenditures accounted for about 21% of total healthcare expenditures, while the bottom 50% accounted for only about 3%.
- Persons ages 65 and older and whites were disproportionately represented in the top spending tiers.
- Inpatient hospital care accounted for 36% of spending for persons in the top 5% of the spending distribution.
Hypertension: Most Common Treated Condition Among Top 5% of Spenders
The most commonly treated condition among the top 5% of spenders in 2018 was hypertension (48.8%), followed by osteoarthritis/other non-traumatic joint dis orders (44.0%) and nervous system disorders (40.0%). In the overall population, however, the percentages of persons who received treatment for these conditions were only 18.9, 16.7, and 12.1, respectively. Figure 1.
Other conditions for which at least 25% of persons in the top 5% were treated include hyperlipidemia; mental disorders; chronic obstructive pulmonary disease (COPD), asthma, and other respiratory conditions; heart disease; and diabetes mellitus. Note that while these conditions are the most common among high spenders, they are not necessarily the most expensive conditions to treat. Rather, the top spending group is more likely to include persons with multiple chronic conditions or expensive treatments (e.g., surgeries, hospitalizations) related to these conditions.

How Does Age Factor into Highest Healthcare Spenders?
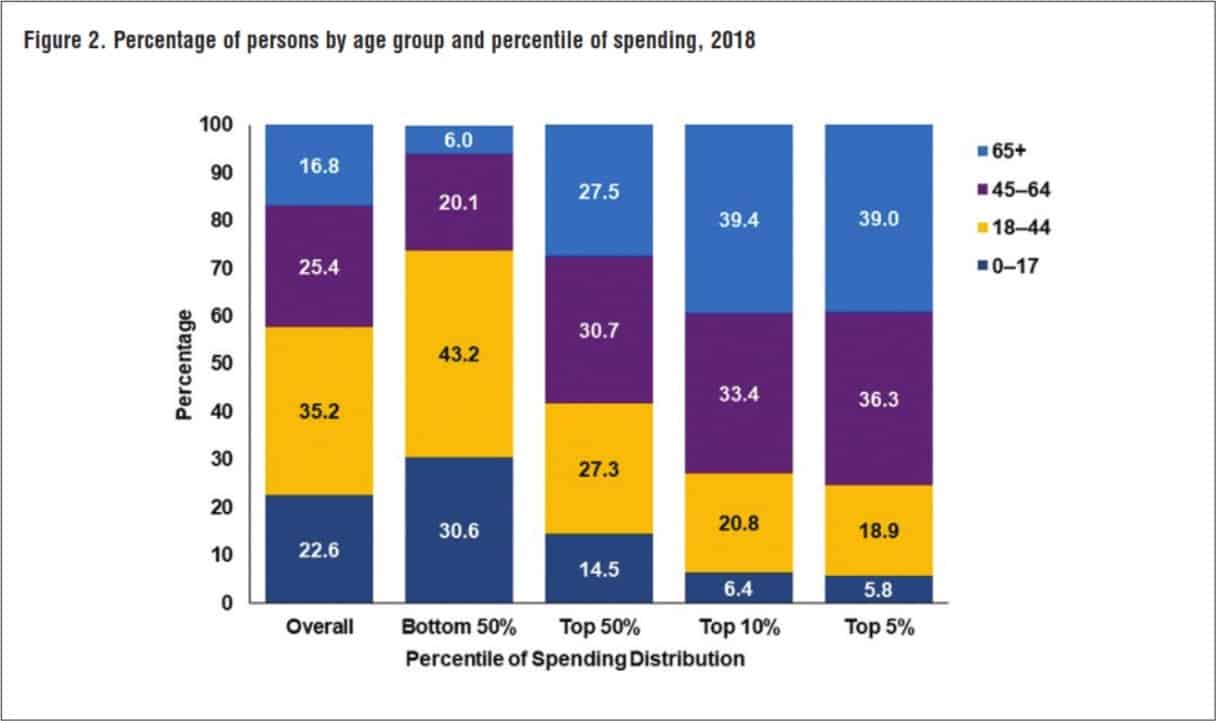
Older persons were disproportionately represented in the higher healthcare spending tiers (Figure 2).
In 2018, 16.8% were 65 and older, while 22.6% were under age 18. Among the top 5% of spenders, 39.0% were 65 and older, while only 5.8% were children under age 18. In contrast, among the bottom 50% of spenders, 30.6% were children while only 6.0% were 65 years and older.
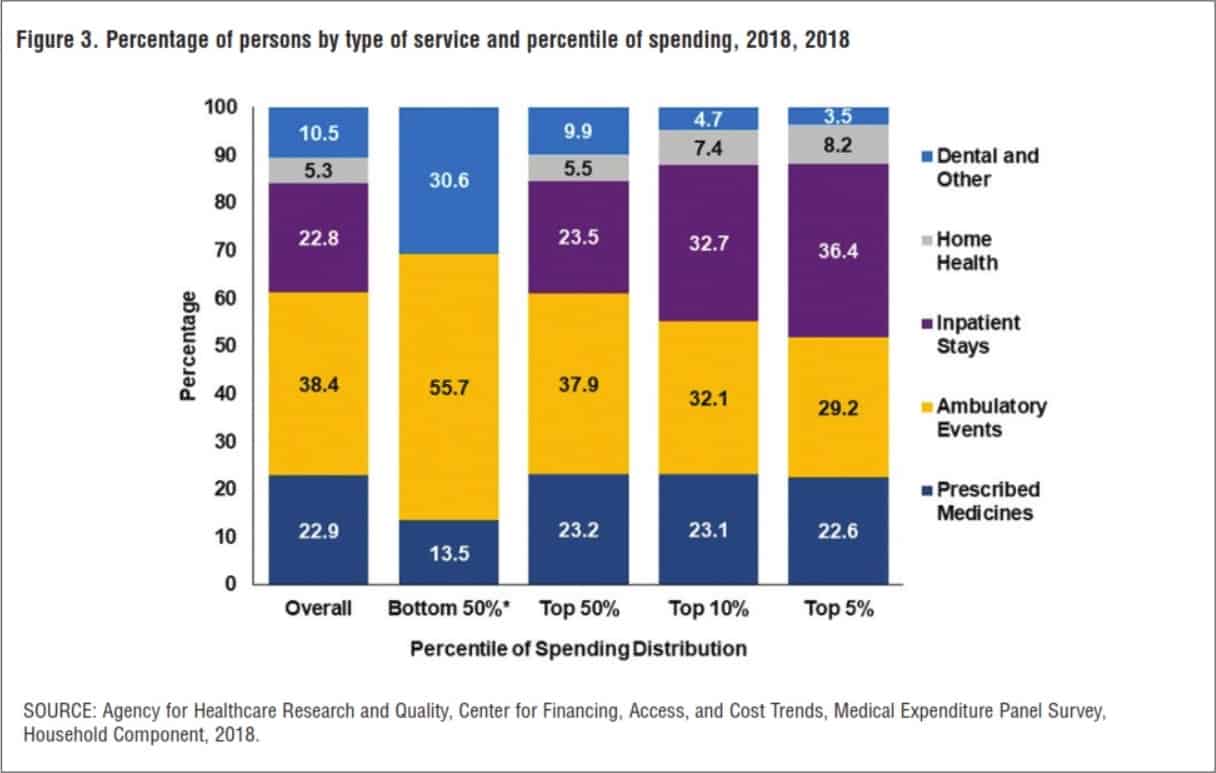
Expenses in the Bottom 50% of Spenders Less Likely to go Toward Home Health
Compared to the overall population, expenses for persons in the bottom 50% of spenders were less likely to go toward in- In 2018, the top 1% of persons ranked by their healthcare patient stays or home health expenses and more likely to go toward ambulatory events (Figure 3).
Among the top 5% of spenders, on the other hand, 36.4% of their expenses were for inpatient stays. This comparatively high proportion of expenditures owes to a combination of the fact that persons in the top spending percentiles are much more likely to have at least one inpatient stay during the year, and those stays tend to cost more relative to other types of service.
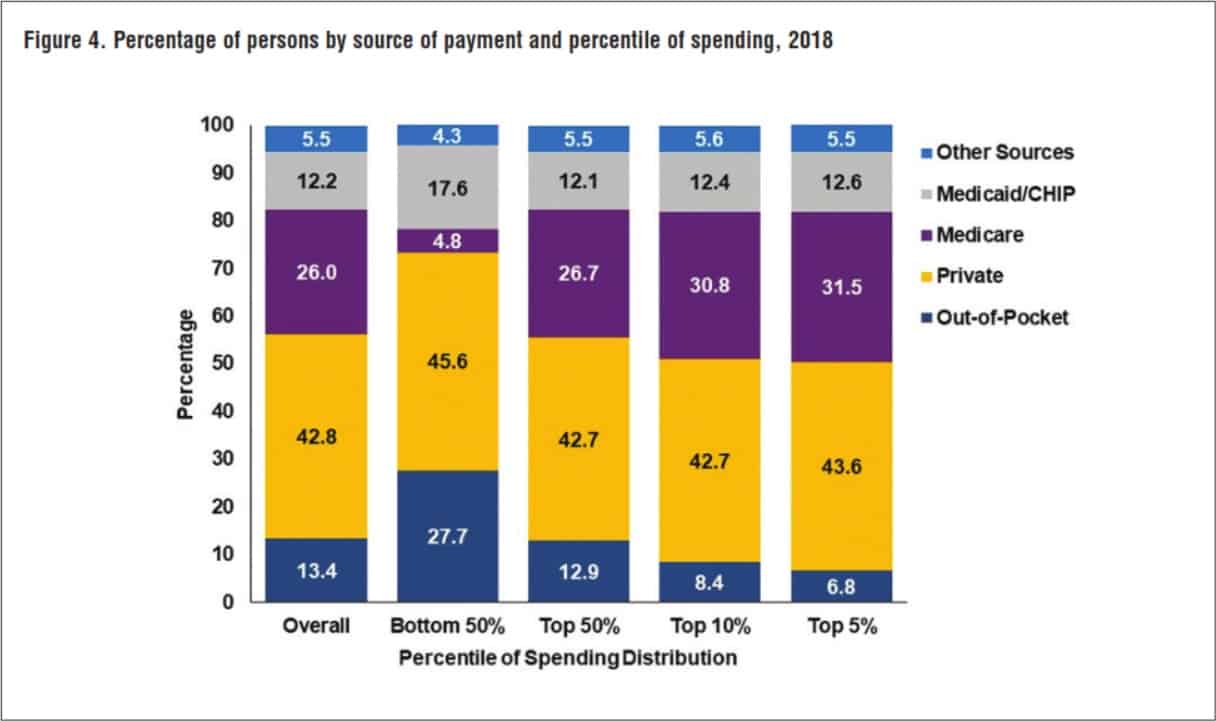
Which Payers are Paying the Most for High Spenders?
Nearly half of aggregate expenses for the bottom 50% of spenders were paid for by private insurance (45.6%), while out-of-pocket payments accounted for around a quarter of the expenditures for this group (27.7%). Only 4.8% of expenditures for this low-spending group were Medicare payments (Figure 4).
For persons in the top 5% spending tier, Medicare paid for 31.5% of their total medical expenses, and private insurance paid for 43.6%. Out-of-pocket payments for this group amounted to only 6.8% of total expenses.
The Top 5% of the Population Account for 48.3% of Total Expenditures
In 2018, the top 1% of persons ranked by their healthcare expenditures accounted for 21% of total healthcare expenditures, with an annual mean expenditure of $127,284 (Figure 5).
The group within the top 1% is defined as persons who spent $72,212 or more during the year. The top 5% of the population accounted for 48.3% of total expenditures, with an annual mean expenditure of $58,609.
The bottom 50% accounted for only 3.2% of total healthcare expenditures. Every person in this group spent less than $1,317 during the year (table 5), with an average annual expenditure of $384 (Figure 5).


Lisa Remington is widely recognized as one of the foremost futurists in the home care industry, focusing on healthcare trends and disruptive innovation. She serves as the president and publisher of the Remington Report magazine and is also the President of Remington’s Think Tank Strategy Institute. Lisa provides strategic advice and education to over 10,000 organizations, assisting them in developing transformative strategies for growth and their future implications. She closely monitors complex trends and forces of change to develop effective strategic approaches.
Other Articles You Might Enjoy

Best Practices for Effective Strategy Execution
Effective strategy execution is crucial for success, as even the most well-crafted strategies can fail if not properly implemented.

5 Reasons Why a 5-Year Strategic Plan May Pose Challenges
Five-year strategic plans in home care often encounter several challenges due to the dynamic nature of the industry.

Understanding Adaptive Leadership in Home Care’s Complex World
Adaptive leadership is not a fixed set of rules or practices; rather, it's a mindset and a skill set that empowers leaders to thrive in turbulent times.