This report finds the most recent shifts in senior’s social determinants of health, urgent needs to support older Americans, long-term trends, and the health of older Americans.
There are nearly 56 million adults ages 65 and older in the United States. America’s Health Rankings, a report by United Health Foundation. Six key factors contribute essential information for all home and community-based organizations.
Improved Access to Care: Two Key Measures
There were continued improvements in two key measures of older adults’ access to care, as the number of geriatric providers and home health care workers per capita both increased. The number of geriatric providers, including family medicine, internal medicine geriatricians and nurse practitioners, increased 8% between 2021 and 2022, from 33.8 to 36.4 per 100,000 older adults — a 26% increase since 2018. Additionally, between 2020 and 2021, the number of personal care and home health care workers per 1,000 older adults increased 5%; it has risen 29% since 2016. The number of home health care workers varied dramatically by state in 2021 and was 9.4 times higher in New York (137.6 workers per 1,000 adults ages 65 and older) than in Florida (14.6).
Physical Inactivity Increased 6% Since 2018
Physical inactivity among older adults did not improve significantly between 2011 to 2021, and older adults may have lived more sedentary lifestyles during the pandemic. Between 2018 and 2021, physical inactivity increased 6% nationwide among adults ages 65 and older in fair or better health, from 29.4% to 31.2%. In 2021, the prevalence of physical inactivity was 2.7 times higher among older adults with less than a high school education (47.8%) compared with college graduates (17.7%).
Social Determinants
More Older Adults Are Living in Poverty
The number of older adults living in poverty has been on the rise, with 5.6 million adults ages 65 and older falling into this category in 2021, representing a 10% increase since 2019. Data from the U.S. Census Bureau show that adults ages 65 and older were the only age group that experienced an increase in poverty between 2020 and 2021.
The prevalence of poverty in 2021 was more than twice as high among older adults who identified their race as other (18.9%), Hispanic (17.7%), Black (17.6%), American Indian/Alaska Native (17.6%) or Hawaiian/Pacific Islander (16.5%) compared with white (8.2%) older adults. Meanwhile, poverty increased 21% among multiracial and 12% among white older adults between 2019 and 2021.

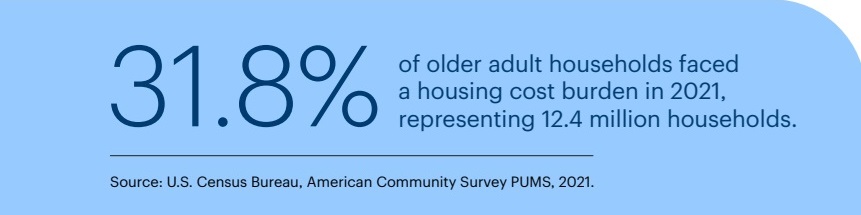
Nearly One-Third of Older Adults Burdened by High Housing Costs
2021 saw significant financial strain on older adult households; nearly one-third (31.8%) faced a housing cost burden, meaning they spent more than 30% of their income on housing. This equated to an estimated 12.4 million households. As more adults enter old age, this challenge could be exacerbated. According to a study from the University of Pennsylvania, adults born between 1955 and 1965 have experienced higher rates of homelessness throughout their adult lives and are likely to contribute to the number of homeless older adults as they age; addressing housing costs will be important moving forward.
Food Insecurity Decreased; Home-delivered Meals Increased
There were positive developments in addressing food insecurity among older adults, including a decrease of 6% in the national rate between 2019 and 2020. This is an important improvement given the impact of food insecurity on health for older adults; according to a JAMA study, food insecurity is linked to a faster decline in brain function among older adults. Meanwhile, the rate of home-delivered meals supported by funding from the Older Americans Act (OAA) increased 79% between 2019 and 2021. However, there is concern that progress may be at risk. As priorities continue to shift following the end of the public health emergency, the expiration of Supplemental Nutrition Assistance Program (SNAP) benefits and other assistance could endanger the gains made in addressing food insecurity.
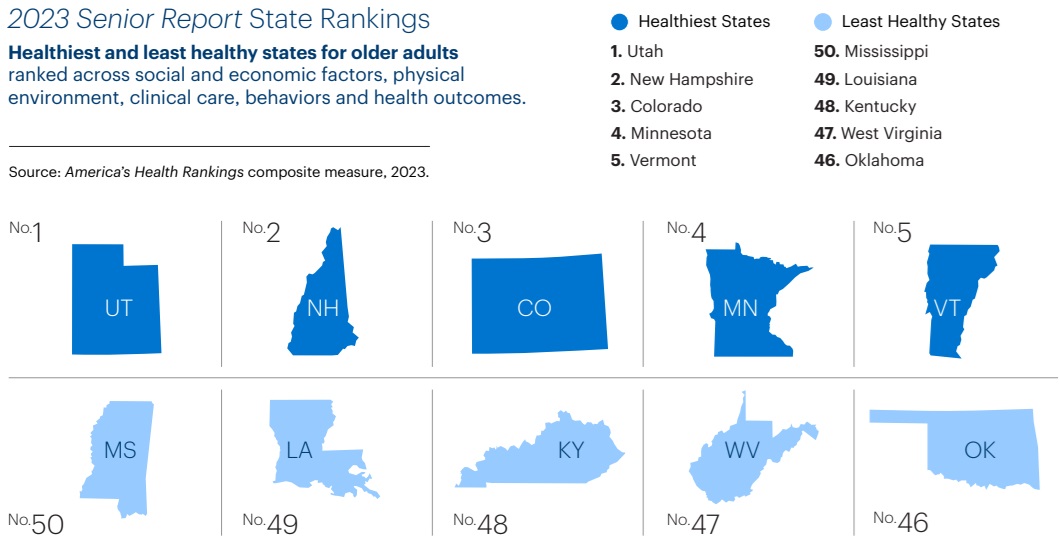
Healthiest and Least Healthiest States
Least healthy and most healthiest states for older adults ranked across social and economic factors, physical environment, clinical care, behaviors and health outcomes.
Healthiest States
- Utah
- New Hampshire
- Colorado
- Minnesota
- Vermont Healthiest States
Least Healthiest States
- Mississippi
- Louisiana 4
- Kentucky
- West Virginia
- Oklahoma
Other Articles You Might Enjoy

5 Reasons Why a 5-Year Strategic Plan May Pose Challenges
Five-year strategic plans in home care often encounter several challenges due to the dynamic nature of the industry.

Understanding Adaptive Leadership in Home Care’s Complex World
Adaptive leadership is not a fixed set of rules or practices; rather, it's a mindset and a skill set that empowers leaders to thrive in turbulent times.

4 Key Challenges to the Future RN Workforce
According to the Bureau of Labor Statistics, registered nursing is one of the fastest-growing occupational fields in the country.